sc digest
 
September 6, 2019 - Supply Chain Flagship Newsletter
border

This Week in SCDigest

bullet Energy, the Supply Chain and CO2
bullet SC Digest On-Target e-Magazine
bullet Supply Chain Graphic & by the Numbers for the Week bullet Distribution Digest/Green Supply Chain
bullet Cartoon Caption Contest Winners bullet Trivia      bullet Feedback
bullet Product Review and Expert Column bullet On Demand Videocasts
NEW FEATURED SURVEY


Important New Supply Chain Research

State of Distribution Technologies 2019


Which technologies are driving the most value, and what users and non-users think about the alternatives?

Take survey, receive detailed summary of results - only for survey participants


first thought

SUPPLY CHAIN NEWS BITES


Supply Chain Graphic of the Week
Top US Cities for Industrial Robot Densities

bullet

US PMI Falls below Key Level in August

bullet
Thousands of Trucks Taken off US Highways
bullet
New US Distribution Hubs Emerging
bullet
Companies Returning to Sourcing from Bangladesh


CARTOON CAPTION CONTEST WINNERS

July 23, 2019 Contest


See Who Took Home the Prize!

ON DEMAND VIDEOCAST
Understanding Distributed Order Management


Highlights from the New "Little Book of Distributed Order Management"

In this outstanding Videocast, we'll discuss DOM, based on the new Little Book of Distributed Order Management, written by our two Videocast presenters.


Featuring Dan Gilmore, Editor along with Satish Kumar, VP Client Services, Softeon.


vpic

Feature Story: Thoughts on the DCs of the Future in the Face of Changes in Requirements and Technology


pic GSC Feature Story:Remembering Warehouseman Richard Murphy and His Practical Green Distribution Perspective
   

ONTARGET e-MAGAZINE
Weekly On-Target Newsletter:
September 5, 2019 Edition


Last Chance Cartoon, DCs of Future, Planning Software, eFulfillment, More


PRODUCT REVIEW
Product Review: Supply Chain Planning Solutions


EXPERT INSIGHT
Is Your Supply Chain Transparent?


by Sarah Trescott
Marketing Manager
Surgere, Inc.

NEW REPORT FROM SOFTEON


What you will learn in this report:

• Why WMS was Slow to the Cloud - but How that is Rapidly Changing

Understanding Cloud WMS Deployment, Pricing and Management Options

Dealing with Concerns about Real-Time WMS Performance in the Cloud

Lessons Learned from Actual Deployments, as the Number of Cloud WMS Deployments Accelerate


TRIVIA QUESTION


The Los Angeles, New Jersey, Chicago and Atlanta metro areas have what percent of total US warehouse space?

Answer Found at the
Bottom of the Page


Energy, the Supply Chain and CO2

In late 2015, some 180 nations came together to agree they would sign the so-called UN Paris Climate Accord. With great fanfare and self-promotion, leaders from around the world agreed to submit plans for reduction in CO2 emissions that collectively would ensure the rise in global temperatures as a result of CO2 would stay under the UN's target of a rise of less than 2 °C above pre-industrial levels. (Though the US later pulled out).

It isn't working.

That is certainly a major takeaway from the freshly released Statistical Review of World for Energy 2019, from energy giant BP. The review is a sort of almanac of all matter of energy related data, now in its 68th year, and as always it is quite an interesting and educational read.


GILMORE SAYS:

Mercedes and cheeseburgers, or lower CO2? A middle path? The 2020 election will be very interesting and consequential indeed.

WHAT DO YOU SAY?

Send us your
Feedback here

The report is full of data on energy production and consumption. Energy of course is at the heart of supply chain in many ways, and central to our lives. A world of relatively cheap, abundant energy would bring prosperity and more income equality to much of the world.

High energy prices have the opposite effect, as we learned in the 1970s and again in 2008.

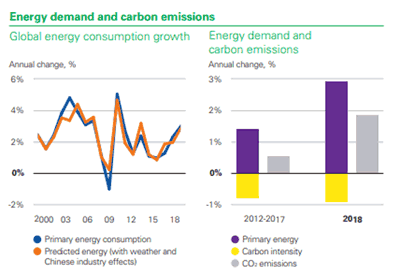
The headline news from the report is that global primary energy consumption grew at a rate of 2.9% last year, almost double its 10-year average of 1.5% per year, and the fastest since 2010.

And since the world still runs primarily on fossil fuels, despite what world leaders and the UN celebrated in 2015, that means CO2 emissions are headed up not down.

I am not CO2 emissions zealot, but the delta between the feel good statements in Paris and the subsequent reality is rather stark.

"My guess is that when our successors look back at Statistical Reviews from around this period, they will observe a world in which there was growing societal awareness and demands for urgent action on climate change, but where the actual energy data continued to move stubbornly in the wrong direction," commented BP's chief economist.

And it's clear why: almost everywhere, political leaders will choose jobs and growth over CO2 reductions. Emissions continue to rise in Green leaning Europe despite more than two decades supposedly addressing the issue through carbon trading and more.

Great timely case in point: news just this week that environmentalists are planning major demonstrations at a huge auto show scheduled in a couple of weeks in Frankfurt, saying German car companies are a big part of the CO2 problem.

But of course, export of Mercedes and BMWs are literally the engine of German economic strength. Maybe those car companies will indeed navigate soon to an electronic car path (which do not reduced total CO2 emissions nearly as much as many believe), but it is likely to take time.

"Do we really want to go to a quarter of people and say you have to give up your car?" said the head of Germany's automaker association when environmentalists suggested that more radical policies were needed.

I am going to make it fairly short and sweet this week, presenting a few key charts from the report.


The first shows on the left half that ironically since 2015 global energy consumption has been rising. On the right, you can see CO2 emissions were up 1.9% in 2018, well ahead of the average rise over the previous five years.


This was mostly the result of generally strong economic conditions seen globally last year. For now and the foreseeable future, economic growth, especially in emerging economies, means rising CO2.

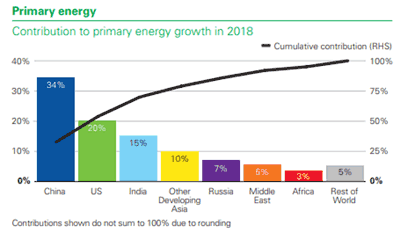
The next chart looks at which countries represented what share of the growth in energy consumption in 2018. China as usual by far led the pack, responsible for 34% of the total growth in energy consumption. The US was second at 15% - driven again almost 3% economic growth - followed by India at 10% of the total.

Surprising to me, other developing Asian countries represented just 10% of the growth.

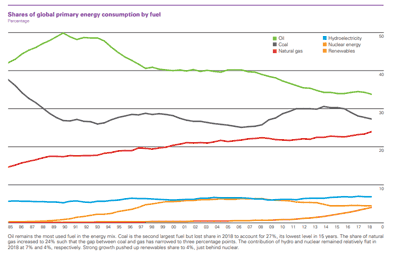
Finally, each year the report shows trends in the share of different energy sources over time, as shown in the graphic below.

While oil's share continues to decline, it is still the top source, at about 34%, with the recent declines in share really leveling off. While coal's share is also declining, it remains the number 2 source - still widely used not only in China but Green thinking Europe. Natural gas has picked up share as utilities switch from coal to gas for producing electricity - driven largely by costs, not CO2.

And alternative sources? As you can see, hydropower has gone flat, with nuclear continuing to decline after the Japan nuclear disasters a few years back.

As for true renewables (wind, solar, bio fuels, etc.), the trend is clearly up but still represent less than 5% of total global energy consumption.

Mercedes and cheeseburgers, or lower CO2? A middle path? The 2020 election will be very interesting and consequential indeed.

The full BP report is available here: Statistical Review of World Energy 2019

Any reaction to this data on energy and CO2? Let us know your thought at the Feedback button below.


On Demand Videocast:

Understanding Distributed Order Management

Highlights from the New "Little Book of Distributed Order Management"

In this outstanding Videocast, we'll discuss DOM, based on the new Little Book of Distributed Order Management, written by our two Videocast presenters.


Featuring Dan Gilmore, Editor along with Satish Kumar, VP Client Services, Softeon.

Now Available On Demand

On Demand Videocast:

The Grain Drain: Large-Scale Grain Port Terminal Optimization


The Constraints and Challenges of Planning and Implementing Port Operations


This videocast will provide a walkthrough of two ways to formulate a MIP, present an example port, and discuss port operations.


Featuring Dan Gilmore, Editor along with Dr. Evan Shellshear, Head of Analytics, Biarri.


Now Available On Demand

On Demand Videocast:

A Blueprint for WMS Implementation Success


If You Want a Successful WMS Project, You will Find the Blueprint in this Excellent Broadcast


This videocast lays out the keys to ensuring your WMS implementation goes smoothly, involves minimal pain, and accelerates time to value.


Featuring Dan Gilmore, Editor along with Todd Kovi of Radix Consulting and Dinesh Dongre of Softeon.


Now Available On Demand

YOUR FEEDBACK

Some of the short feedbacks on our recent columns summarizing the 2019 State of Logistics report from CSCMP. Here are a few.

Feedback on State of Logistics Report Coverage.

comma

SCDigest does an amazing job with this. You take a very long document and boil it down to its essence in just one or two columns.


This is a great service to the industry - thank you.


Michelle Watson
Ft. Wayne, IN


comma


I agree with you on the timing. By the time the report shows in late June, my interest in 2018 data has faded. We're already starting to look ahead to the next year.


I don't have a magic wand on how this could be changed to get the report out earlier, but it would make it much more valuable.


Mark Fitz
Stow, OH


comma


It would be very interesting to know logistics costs as a percent of GDP in other countries. Can this be provided?


Amy Danko
Kansas City


Editor's Note:


We'll see what we can do.


comma


I really like the way you take a long report and break it down into the key statistic. It's a pleasure to read, and I watched the excellent video summary itself on the Video News.


Brian Toomay
Atlanta

SUPPLY CHAIN TRIVIA ANSWER

Q: The Los Angeles, New Jersey, Chicago and Atlanta metro areas have what percent of total US warehouse space?

A: 29%, according to Cushman & Wakefield.

© SupplyChainDigest™ 2003-2019. All Rights Reserved.
SupplyChainDigest
PO Box 714
Springboro, Ohio 45066
POWERED BY: XDIMENSION