State of the Logistics Union 2019
2018 was a tough year for US shippers, though that's hardly news to almost all of them.
Nevertheless, it is always interesting to see the activity and trends analyzed and quantified, which we get each year from the Council of Supply Chain Management Professionals (CSCMP), which is out this week is out with its 2019 State of Logistics Report, looking at 2018 data.
The headline news: after remaining flat in relative terms in 2017, logistics cost were back on the march again in 2018 - to no one's surprise. What the report started calling a couple of years ago United States Business Logistics Costs (USBLC) were up an incredibly strong 11.4% in absolute terms last, driven by especially sharp increases in the first half of the year.
| GILMORE SAYS: |
Notably, spend on dedicated trucking rose a robust 13.1% in 2018, as shippers looked to lock up capacity in the tough freight environment last year.
WHAT DO YOU SAY?
Send us your
Feedback here
|
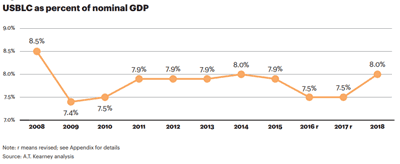
With that strong growth in logistics spending when compared to just decent nominal GDP growth, US logistics costs as a percent of GDP rose sharply to 8.0% versus a revised 7.5% in 2017, as shown in the chart below. That jump of half a percentage point is an increase of 6.25%, taking the measure to its highest level since 2014.
With sharp rises in truckload rates, warehouse lease rates continuing to be strong, and lots of inventory brought in at the end of 2018 to beat looming January tariffs, I am actually a bit surprised the jump wasn't higher.
To get to this key number, you take the number for US logistics costs - from trucking to pipelines - and divide it by annual nominal (not real) GDP numbers. Voila, logistics costs as a percent of GDP emerges. The methodology must use nominal not real GDP as the denominator because the costs for the year are compiled in nominal terms.
What's in store for 2019? That is far from sure. We may be near or already past a top and will see costs heading further down with a (perhaps) weakening economy- which is why this year's report is titled "Cresting the Hill."
The peak in the past dozen years was 2007 (not on chart), when logistics costs hit 8.59% of GDP, close to where it was in 2008 (8.5%) before taking a steep drop in the recession year of 2009 to 7.4%. From there it actually stayed in a fairly tight band before falling in 2016. The rise in 2018 to that 8.0% level puts it back in that narrow 2011 to 2015 band. Perhaps this range is the new normal.
This now the fourth report produced by consulting firm AT Kearney since it took over authorship after a competitive bidding process by CSCMP several years ago. Six Kearney consultants are cited as the report's authors, but a number of contributors from industry are also called out. That includes Marc Althen of Penske Logistics, Ravi Shanker of Morgan Stanley, Brent Hutto of Truckstop.com, Derek Leathers of Werner, and Bob Biesterfeld of CH Robinson, plus significant help with data sourcing from IHSMarkit.
This is actually the 30th edition of the State of Logistics report, which was launched in 1988 by the late Bob Delaney and sponsored by his company, Cass Information Systems. Somewhere along the way, CSCMP took over the sponsorship.
Again this year, Penske Logistics funded the report development, and the results were as usual released at a major media event at the National Press Club in Washington DC on Tuesday.
The report spends quite a few pages citing all the current warning signs that the economy may be slowing, and perhaps at risk of falling into recession, though most seem to just be forecasting slower growth.
For example, according to the IMF, US GDP growth will slow to 2.3% in 2019 and then 1.9% next year. The result will likely be falling rates for shippers, but at the price of a slower growth business environment.
But that slowdown is far from certain. Consumer confidence and consumption data have remained at strong levels.
The report also warns of the logistics risks of climate change (e.g., rising water levels at global ports), and says "All logistics players must anticipate more extreme weather-related disruptions in 2019 and beyond."
I am actually not so sure that is true, but that's a topic for another day.
Kearney is actually optimistic that a slowdown in economic growth, and thus freight volumes and rates, may drive more collaboration between carriers and shippers. It cites for example the "shipper of choice" programs many companies have launched, and collaborative contracts between shippers and carriers to improve sustainability in part through better asset utilization.
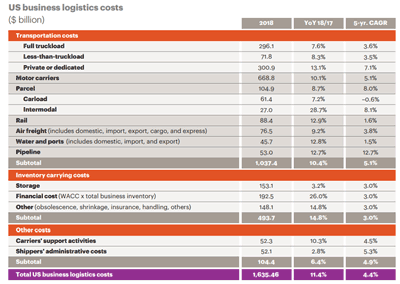
The total cost of US logistics was estimated at $1.64 trillion for 2018, again up 11.4% from 2017. Kearney says the average annual growth in logistics costs - again including inflation - is a solid 4.4% over the past five years - up from a 3.2% in the five years before the big increase in 2018.
Underneath the overall logistics cost number, transportation costs - the largest single component of USBLC at 63.3% of the total - was up by 10.4% in absolute terms in 2018. The second component, inventory carrying costs (30.1% of the total), was up a huge 14.8% last year under the report's calculation, which includes the cost of warehousing and inventory levels but also the cost of capital (which drives the cost of holding inventory). That total cost of holding inventory was up 26% versus 2017, mostly driven by big jumps in inventory due to early imports to beat tariffs.
"Other" costs - always somewhat vague and mostly related to certain IT expenses and some services such as freight forwarding - were up 6.4%, though this is by far the smallest of the three main categories at just 6.4% of the total number.
You can find the full breakdown by logistics cost bucket in the chart below:
Within transportation, trucking-related spend (including private fleets but excluding parcel) comprise 64.4% of total transport costs and 40.9% of total logistics spend - both numbers down a couple of percentage points from last year's percentages, for reasons not clear to me.
Notably, spend on dedicated trucking rose a robust 13.1% in 2018, as shippers looked to lock up capacity in the tough freight environment last year.
Parcel shipping costs were estimated at $104.9 billion in total, up 8.7% over 2017. That represented 10.1% of transport costs and 6.4% of total logistics spend. Those two percentages are both down a couple of ticks from 2017, which surprises me given the 15% growth or so in ecommerce last year. Not sure how to reconcile that - some Amazon effect?
At $88.4 billion in 2018, rail comprised 8.5% of transportation spend - up from 8.3% last year. Rail was also 5.4% of the total logistics costs, the same as last year. But the US spent about $16 billion more in parcel shipping than it did in rail transport last year - interesting.
In terms of growth in spending by these various categories, the 5-year average annual growth rate in costs by mode or cost category are as follows, according to the report:
| Truckload: 3.6% |
Parcel: 8.0% |
Waterways: 1.5% |
| LTL: 3.5% |
Intermodal: 8.1% |
Warehousing: 3.0% |
| Private/dedicated fleet: 7.1% |
Rail total: 1.6% |
Inventory carrying: 3.0% |
| Trucking combined: 5.1% |
Air freight: 3.8% |
|
There are some big changes in many of these CAGR numbers from the 2018 report, and I am not sure what caused these changes.
With overall logistics costs rising 4.4% per year over the past five years, comparing the rise in any specific areas versus that 4.4% overall number will indicate whether a category gaining or losing share of total spend (not the same as tonnage).
Trucking, for example, is still gaining in share of spend versus rail, while truckload and parcel are gaining share versus LTL. Intermodal's five-year average growth of 8.1% is far above that 4.4% rise in total logistics costs.
Warehousing (storage) costs are running below with total logistics spend over the past 5 years, as lease rate growth slowed a bit to 4% on average last year, but this is still puzzling. Increased efficiency must be playing some role there. For carrying costs, I will note the US inventory-to-sales ratio rose sharply in 2018 after falling for most of 2017.
The report has a lot more detail on each mode and cost bucket, as well as the overall economic and logistics environment, which I don't have room for here.
The report also includes special sections on blockchain and the supply chain, and the potential of looming 5G wireless technology to really impact the logistics sector. I will summarize these sections next week.
My bottom line view: Kearney and CSCMP continue to improve this report, and it is well worth a read. As I have said in the past, I wish they could find some way to get the report done earlier in the year. I understand the many challenges in making that happen - but believe it could be done, even if some data has to be revised later. It seems clear though the report is making efforts to discuss a more current view, even if the base is 2018 data.
CSCMP members can already download a copy for no charge, others purchase one for a modest fee. I recommend it.
Any reaction to our summary of this year's State of Logistics? How could the report be improved? Let us know your thoughts at the Feedback button below. |


![]()

![]()

![]()

![]()
