Walmart and Amazon by the Numbers 2019 Part 2
My column a few weeks ago on Walmart and Amazon by the Numbers 2019 once again proved very popular, with a number of readers emailing "give us more." That response, plus the fact that I have a lot of fun doing this, brings me back this week, with some additional data and charts.
| GILMORE SAYS: |
Amazon fulfillment costs (FC operating costs, FC depreciation, some inbound logistics costs) were $34 billion last year, up about $36% over 2017 - when "on-line" sales were up just 13%.
WHAT DO YOU SAY?
Send us your
Feedback here
|
I will again quickly note that a few readers commented that my first column alerted them to the fact that you really have to dig into almost any numbers reported by someone to see if they make sense and/or understand what the data really means in context - take few numbers at pure face value.
OK, to first put the numbers from both of my columns in perspective, let's first look at the rise of ecommerce. According to the Commerce Dept., ecommerce sales were about 9.9% of total retail sales last year, up from 9.5% in 2017 - but those total retail numbers include sales of cars, gas stations, restaurants and a few other categories that are not really relevant for comparison.
So, we compute the numbers based on the same formula we used in the first column to analyze Walmart's share of US retail, for which we take total retail and subtract out those non-relevant categories. Using that formula, ecommerce sales were a much higher 14.9% of total US retail sales in 2018, up strongly from 13.3% in 2017. Of course, that share is much higher in some product categories, such as electronics and apparel.
See Full Image
In my first column, we also graphed the annual percentage growth for Walmart's US retail sales, which slowed noticeably a few years back but have rallied a bit the last two years. Below we show the Walmart numbers in absolute terms across its three reporting units: US, Sam's Club, and International. All units have seen the pace of growth slow sharply, though US sales were up a solid 4.1% in 2018. The on-going big slowdown in international remains a bit puzzling . Basically, Walmart's total sales are close to flat since 2013.
See Full Image
The cumulative average revenue growth rate (CAGR) for each unit and total sales since 2010 is shown beneath the main chart. Walmart has had a CAGR of 5.2% for total sales from 2002 through 2018, but that clearly came much more from the first half of that period than the last few years. Since 2010, total revenue has grown 2.49% annually, with international rising just 1.27% per year, and surprisingly the fastest growth in the most mature segment, US retail, at 3.08%. Still the decent 3% total growth in 2018 represents almost $15 billion in new growth - that's a good sized retailer on its own.
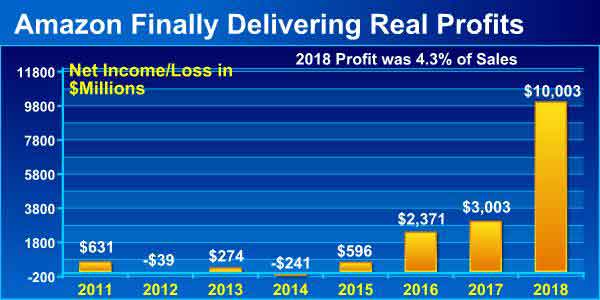
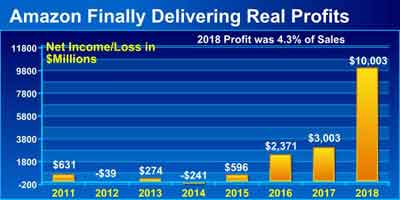
Switching gears, Amazon for years received much criticism for its consistent failure to really make any money, but that started to change in 2016 and was blown up for 2018, as can be seen in the chart below. Net income for 2018 was up dramatically to over $10 billion last year, and reached 4.3% of sales, both those numbers far exceeding previous highs.
See Full Image
However, 58% of its operating income came from its AWS web services unit.
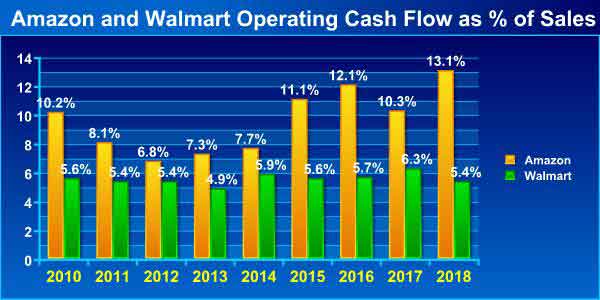
For years some said to look at Amazon's cash flow from operations instead of profits, a view which has painted a more favorable picture when profits were low.
Operating cash flow as a percent of revenue has generally been much higher at Amazon than at Walmart for many years - and was almost three times so in 2018.

See Full Image
In fact, despite having less than half the revenue, Amazon had higher operating cash flow in absolute terms last year, at $30.7 billion versus $27.7 billion for Walmart.
But there is operating cash flow and then what is called "free cash flow," or operating cash flow minus capital expenditures, and here the story is also interesting.
Amazon had that $30.7 billion operating cash flow in 2018, and had CapEx of about $$13.4 billion, up more than $11.9 billion in 2017. So that means CapEx was 44% of operating cash flow, about the same as 2017.
Walmart, on the other hand, had CapEx of about $10.3 billion - almost the same as in 2017. With $27.7 billion in operating cash flow (OCF), that means CapEx of about 37% of OCF, though with Walmart now generating less OCF than its rival. (Note: as a proxy for official CapEx, I am using spending on real estate, equipment and technology).
Importantly, Walmart also has to pay a dividend from its cash flow- $6.1 billion worth last year - while Amazon does not. So Amazon's operating cash flow minus CapEx spend = $17.3 billion in 2018. Doing the same calculation with Walmart but also subtracting the dividend leaves it with $11.3 billion in free cash. That for the first time is lower than Amazon total.
The dividend factor is huge and a giant advantage for Amazon while it lasts.
In the first column I lamented that Amazon now only provides total shipping costs, not net costs including shipping revenues as it did for years. It also stopped reporting merchandise sales, which I used as the denominator for several ratios, as the best approximation for product sales that require fulfillment and shipping activities.
So I am not quite sure any more how to best quantify fulfillment and shipping cost ratings (shipping is not part of fulfillment costs, by the way).
Fulfillment costs (FC operating costs, FC depreciation, some inbound logistics costs) were $34 billion last year, up about $36% over 2017 - when "on-line" sales were up just 13%.
I have lots more, but I am out of space. Hope you have enjoyed this look at the numbers.
Any reaction to these numbers from Amazon and Walmart? Any other data you would like to see? Let us know your thoughts at the Feedback button below. |