Walmart and Amazon by the Numbers 2019
For several years I have been doing some analysis and comparisons between Walmart and Amazon, the two most important retailers in the world.
Walmart earns that place due to its stature as the world's largest merchant (and company) and one that represents an often substantial share of many consumer goods companies' total sales. Amazon obviously earns a spot as the dominant ecommerce company - at least in North America and Europe - and ecommerce is where all the action is right now, sucking most of the oxygen out of the retail room. Amazon is also now probably the second largest overall US retailer, passing Kroger last year, but you can't be sure based on how it reports the number.
Amazon's actual or potential threat to a growing number of retail sectors is often existential, and it is taking that to ever more product areas, such as drug stores/pharmaceuticals with its acquisition of on-line pharmacy Pillpack last year.
You can make an argument I should throw China's Alibaba and maybe even JD.com into this mix as other ecommerce giants - maybe next year I will. They both remain China-centric - for now.
| GILMORE SAYS: |
By our measure, Walmart had an 10.9% of US retail sales in 2018, basically flat over the past 5 years, and down from a peak of 12% in 2009.
WHAT DO YOU SAY?
Send us your
Feedback here
|
So we've been looking at both of these retail giants "by the numbers" in recent years, and it has become one of our most popular columns of the year, forwarded by many SCDigest readers to others in their companies.
But as I will explain in a second, getting your arms around the numbers is often harder than you might think.
What Walmart and Amazon are doing is obviously of interest to most other retail and consumer goods manufacturers, and I hope others as well, as in the end almost every company is connected to the retail supply chain.
So let's start with Walmart, based on its its full fiscal year 2018, ending this past January.
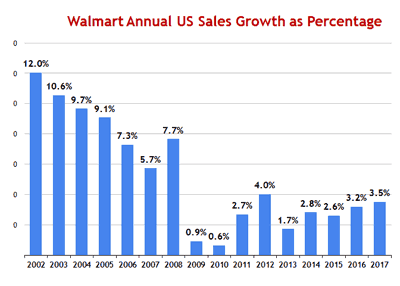
As can be seen in the chart below, Walmart's US sales grew very rapidly in the beginning years of the 2000s, primarily by adding new superstores carrying groceries at a rapid pace into new markets.
But that growth soon decelerated, and in the recession year of 2009 started a pattern of mostly very low growth (2012 being an exception) for five years that was not much above inflation on average, meaning real growth was almost flat or up a percent or so at best. But the news is better in the past two years, with Walmart US showing strong growth of 4.1% in 2018.
Total Walmart US sales (Walmart US + Sam's Club) reached $389.5 billion last year, well more than double the $188 billion the company had in 2002, but the pace of that growth has obviously slowed substantially down. The Cumulative Average Growth Rate (CAGR) for Walmart US has averaged 5.2% since 2002, but has slowed to 3.1% since 2010.
Walmart's international growth continues to plateau, despite an lot of attention and investment there in the past. Walmart international sales last year were $120.8 billion, up 2.2%, after a 1.7% . increase the previous year. Still, international is clearly not the Walmart growth engine once imagined, though Walmart did acquire a majority stake in Indian ecommerce site Flipkart in April 2018.
Walmart still doesn't provide much detail on its ecommerce numbers, but says it saw 40% growth in on-line sales in the US in 2018. Analyst estimates put its ecommerce sales in the $12 billion or so range in 2018, still a small fraction of Amazon's on-line revenues.
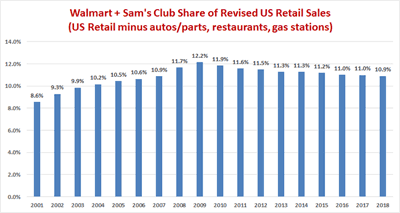
Not all that many years ago, there were concerns (I think legitimately at the time) about Walmart gobbling up a giant, monopolistic share of the US retail market. That fear has simply faded. With the recent modest sales growth, Walmart's share of US retail has flatlined. SCDigest developed a methodology several years ago, where we compare Walmart's US sales versus relevant US retail figures - total retail minus autos and parts, gas stations and other fuel sales, and restaurants/bars.
It's not quite perfect because Walmart does sell some gasoline, but it doesn't break it out in a way we can use. Nevertheless, I think what we have is pretty good - and does reflect a higher share of US retail for Walmart than if you do not exclude those categories, which is how it is usually reported. When you hear all these numbers, make sure you understand how they are calculated.
By our measure, Walmart had an 10.9% of US retail sales in 2018, basically flat over the past 5 years, and down from a peak of 12% in 2009. It simply does not appear any more that Walmart will take over the retail industry. That is an interesting and important change - and its share seems unlikely to go much higher to me, absent an acquisition. Would the FTC now let Walmart buy say Kroger or CVS? Probably not, but hard to say for sure.
Now let's turn to Amazon, a company that provides a lot of numbers to analysts but getting the best insight from them takes some work. That is because of its several business units and how it computes certain ratios, and (unfortunate) changes it has made in the past couple of years in what numbers it provides.
Total sales in 2018 were up 31% for the second straight year to an incredible $232.8 billion, but that includes digital media sales, subscriptions, and its rapidly growing and highly profitable web services unit.
For a number of years I thought it was more interesting to look to look at what Amazon called "merchandise" sales, almost all on-line, since that included a close analog to traditional retail sales and were most connected to a physical supply chain.
But Amazon no longer provides the merchandise sales numbers. It now provides "product" sales, but that includes, for example, sales at its Whole Foods grocery unit. Product sales were up 20% to $141.9 billion last year on a global basis. You can get global product sales, and North American sales, but what you can't get is North American product sales, among other limitations.
So I made up my own metric. I took what Amazon reports as sales from "on-line stores," then added revenues from what Amazon calls third-party services. That latter number includes commissions the company gets from its marketplace sellers (for which Amazon does not take inventory ownership), and revenues from Amazon's third-party logistics services, including Fulfilled by Amazon (FBA).
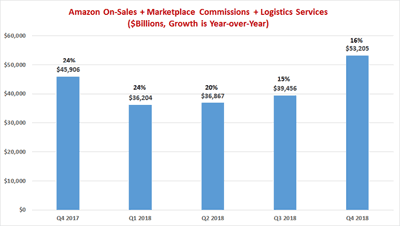
Interestingly, on-line sales, while still up healthy 13%, have clearly slowed as the law of large numbers finally seems to actually apply to Amazon as well . But marketplace sales are growing much faster than Amazon's own on-line sales. So combining them, Amazon sales are up in the 15-16% range the last two quarters by this measure.
In the end, I am trying to adjust the numbers Amazon reports for things like shipping and fulfillment costs against the right denominator, using for many years the now unavailable merchandise sales. That's because including shipping in comparisons including say web services revenues doesn't make sense.
So the best I can do is compare the change in shipping costs to on-line sales revenue growth:
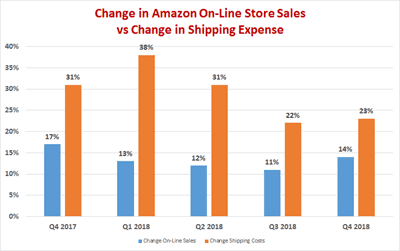
Shipping costs are obviously rising at a much higher rate, generally about double on-line sales growth. Though you can no longer directly calculate the number, Amazon is certainly still losing billions in shipping every year.
I am out of room, even though I have more. Will do a part 2 on this as I did last year in a week or two, including an interesting look at free cash flow.
Any reaction to these numbers from Amazon and Walmart? Any other data you would like to see? Let us know your thoughts at the Feedback button below. |


![]()

![]()

![]()

