 |
January 25, 2019 - Supply Chain Flagship Newsletter |
 |
|
||||||||||

 |
|
|||||||||||||||||||||||||||||||||||||||||||||||||||||||||||||||||||||||||||||||||||||||||||||||||||||||||||||||||||||||||||||||||
|
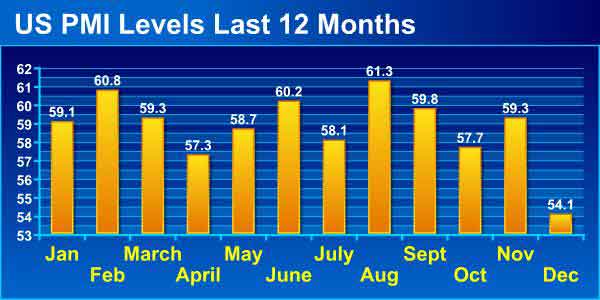
||||||||||||||||||||||||||||||||||||||||||||||||||||||||||||||||||||||||||||||||||||||||||||||||||||||||||||||||||||||||||||||||||
Another view of US manufacturing strength is the index on output for US factories from the Federal Reserve.
|
||||||||||||||||||||||||||||||||||||||||||||||||||||||||||||||||||||||||||||||||||||||||||||||||||||||||||||||||||||||||||||||||||
With a score of a strong 106.2 in December, US manufacturing output was still just 6.2% above the average month in the baseline year of 2012, indicating very weak annual growth of less than 1% in the six years since. What's more, as can also be seen in the chart, that also means 2018 output remains well below the peak year of 2007, when the index reached an historic high of 110.0 in December. Oil prices had an interesting interesting year. WTI prices started rising in July of 2017, and as can be seen below and kept rising from the start of the year into September, when it hit $75/barrel, with some predicting $100 soon. But the bottom fell out right after that, with WTI down 31% from the start to the end of the year. |
||||||||||||||||||||||||||||||||||||||||||||||||||||||||||||||||||||||||||||||||||||||||||||||||||||||||||||||||||||||||||||||||||
US diesel prices showed lest volatility, starting the year at $2.97 and then staying within about 30-40 cents of that price before reaching a high of $3.39 in October. But diesel prices ended the year about where they started, at $3.04. Commodity and input prices were generally up for most of 2018, with talk that inflation was re-entering the supply chain. The ISM Prices index was up for the 34th straight month in December, though the rate of increase was slowing as the year ended. Freight volumes all told were very strong though perhaps slowing as we ended the year. the ATA Freight Tonnage Index was up 6.6% for the full year, the largest annual increase since 1998 and double the 3.7% increase in 2017. However, freight volumes were down 4.3% in December versus November.
Rising volumes plus the driver shortage naturally pushed truckload rates higher - much higher. The Cass truckload Linehaul Index,which tracks truckload rates, was up 6.5% year-over-year every month of 2018, and up more than 9% May through September. It ended the year up a robust 7.2% in December. |
||||||||||||||||||||||||||||||||||||||||||||||||||||||||||||||||||||||||||||||||||||||||||||||||||||||||||||||||||||||||||||||||||
It was again decent year for the railroads. Total US carload traffic for 2018 was up 1.8%, while intermodal traffic up 5.5%. Combined rail volumes were up 3.7%. In terms of ocean container carriers. The China Containerized Freight Index started the year at about 825 (versus 1000 in the baseline rate in November, 2012), and in general rose slowly for most of the year, though not enough to deliver strong profitability to container carriers. The index ended the year a little above where it started.
The WTO recently projected that the volume global trade was up 3.9% last year, down from 4.2% in 2017, and right around global GDP growth. Not long ago, trade far exceeded GDP growth. It estimates a lower 3.7% trade growth in 2019.
|
||||||||||||||||||||||||||||||||||||||||||||||||||||||||||||||||||||||||||||||||||||||||||||||||||||||||||||||||||||||||||||||||||
The growth of ecommerce sales in the US also rolled on, up 16.3%, 14.9%, and 14.5% in Q1 through Q3, respectively. Ecommerce represented 9.8% of total retail sales in Q3, by the government's calculation, but the way SCDigest figures it, the share is now over 11%. Total retail sales were up a a strong 5.0% or so in 2018, but ecommerce continues to rapidly gain share. Amazon's overall revenues through Q3 up 37% to an incredible $160.5 billion, meaning full year 2018 sales will be close to an "Amazonazing " $200 billion when reported soon. Amazon on-lines store sales though Q3, however, were up just 10%. But Amazon saw 31% growth in services, which includes its marketplace, fulfillment by Amazon, and web services. Amazon had record profits through Q3 of $7billion, versus $1.95 billion in 2017. It employes 613,000 people.
|
||||||||||||||||||||||||||||||||||||||||||||||||||||||||||||||||||||||||||||||||||||||||||||||||||||||||||||||||||||||||||||||||||
|
||||||||||||||||||||||||||||||||||||||||||||||||||||||||||||||||||||||||||||||||||||||||||||||||||||||||||||||||||||||||||||||||||
 |
||||||||||||||||||||||||||||||||||||||||||||||||||||||||||||||||||||||||||||||||||||||||||||||||||||||||||||||||||||||||||||||||||


|
|
|


YOUR FEEDBACK
We received several emails on Dan Gilmore's First Thoughts column on his supply chain Christmas wish list for 2018 - including an interesting note from Jim Tompkins.
Feedback on Christmas Wish List:
![]()
Thanks for the note on "My friend Jim Tompkins is still thought leading, but he has a lot of business irons in the fire right now and seems to have slowed down a bit on the thought leadership side."
Sorry we have not been in touch on this. In my view, my thought leadership hit an all time high in 2018. Please consider
• Distributed logistics (LaaS-Logistics as a Service)
• DIFF- Distributed Inventory Flow Forecasting: Multiple fulfillment locations without increased safety stock
• MSP- MONARCHFx Sellers Platform: Self registration and integration platform
• Tompkins Robotics- 9 Patents, more coming
• New Retail: Uni-marketing, Uni-channel and Uni-logistics
• Robotic induction
• Disruption cycle
• Digital Enterprise World
• The challenge of brittle solutions due to uncertainty over uncertainty
• Demand shaping application
• Speed of implementation
I believe your perception of "slow down" is a result of current thought leadership is less published as thought leadership and more positioned as entrepreneurial deployment (thus your view of "irons in the fire"). So, application of thought leadership is at all time high, but number of thought provoking keynotes is down.
As always Dan, good stuff.
James A. Tompkins, Ph.D.
Chairman and CEO
Tompkins International

![]()
An interesting list of supply chain wishes.
I had not really thoughts about the fact that we lack clear supply chain thoughts leaders - think this observation is spot on.
What is driving this problem is not clear, however. Surely they are out there somewhere.
Ron Halpin
Toledo, OH
a
![]()
You might hope supply chain academic research was more valuable, but Santa is unlikely to grant your wish.
Academics in all disciplines write for each other and to get published, with little concern over whether there is any practical value.
As you note, a lot of talent and opportunity basically wasted. But it will never change.
Thomas Wright
San Diego
SUPPLY CHAIN TRIVIA ANSWER
Q: Last August, Maersk Line set a new record for most TEU carried on one ship. How many (within 500 TEU)?
A:19,038.
| © SupplyChainDigest™ 2003-2019. All Rights Reserved. SupplyChainDigest PO Box 714 Springboro, Ohio 45066 |
POWERED BY: XDIMENSION
|