SCDigest Says: |
 One might conclude that the DIO numbers reported by CFO are understated, reflecting a end of period drop in inventories, meaning DIO on an average basis is actually higher than reported by CFO. One might conclude that the DIO numbers reported by CFO are understated, reflecting a end of period drop in inventories, meaning DIO on an average basis is actually higher than reported by CFO.

Click Here to See Reader Feedback
|
Last week, SCDigest editor Dan Gilmore as usual reviewed the annual Working Capital Report from CFO magazine and the consultants at REL, which reports data across more than two dozen industry sectors and hundreds of companies. The full analysis looks at all three components of Working Capital (payables, receivables, and inventory), but we focus our analysis on the inventory portion. The recently released report uses end of year 2009 numbers for publicly traded companies. (See Gilmore’s column at Inventory Performance in 2009).
Before we look at some additional aspects of the inventory numbers, a few comments.
As noted in the article, CFO reports inventory in terms of Days Inventory Outstanding, or DIO. That metric measures how many days of sales, or revenue, a company has in inventory. The formula for DIO is:
Inventory/[total revenue/365]
with inventory being measured as the balance sheet number at the end of the year, and revenue the same from the end-of-year income statement.
Several readers, as usual, chastised us for using total revenue in the divisor, saying the right metric to use is cost of goods sold (COGS). There is certainly a case for that, but we are reporting on the CFO numbers, and that analysis uses revenue. A separate analysis would have to be performed to use COGS.
Second, some point out that using the end of year inventory number can be deceiving. Why? Because companies can sometimes play games with end of period inventory numbers, for tax or Wall Street reasons. The end of a quarter is often a heavy shipping period for most companies, meaning their inventory levels may be artificially lower at the end of the last quarter in the year than during the year. Retailers generally end their fiscal years the month after the heavy Christmas shopping season, again perhaps leading to a distorted picture of true inventory levels.
It would be much better to use average inventory levels during the entire year for sure, and companies doing an internal analysis should be able to calculate average inventories from their ERP or other accounting systems.
Alas, average inventory levels are not available from public financial filings.
So, one might conclude that the DIO numbers reported by CFO are understated, reflecting a end of period drop in inventories, meaning DIO on an average basis is actually higher than reported by CFO.
The good news is that because the same methodology is used each year, even if somewhat distorted by the factors above, the trends of up or down within an industry sector or specific companies should still usually be valid.
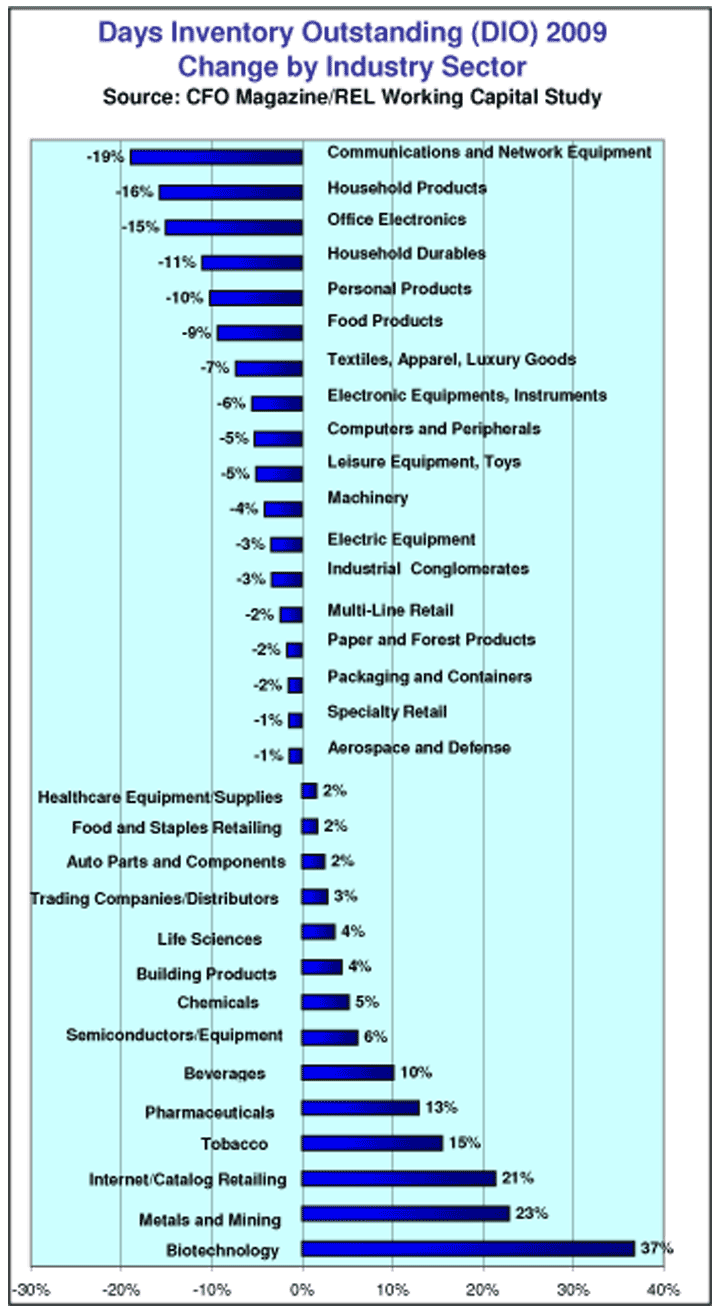
SCDigest looked for some additional trends in the data, but we found few clear patterns. Below, we republish the chart from last week that shows the change in DIO, or inventory performance, by sector from best (greatest decrease in DIO) to worst.

The data does support the idea that manufacturers were faster to react to the economic slowdown in 2009 and to start paring inventories versus retailers, as others have noted earlier. (See Recession Showed the Bullwhip Effect in Action, Arizona State Researchers Say.)
For example, consumer goods categories such as household products (-16%), household durables (-11%), personal care products (-105), food (-9%) and even textile/apparel (-7%), all showed steeper drops in inventories than department stores and mass merchants (-2%) and specialty retail (-1%).
However, the “end of the year” factor comes in to play, as these numbers again only look at the state of inventories at the end of 2009, and thus do not really show the reaction earlier in the year, as the recession unfolded.
(Supply Chain Trends and Issues Article - Continued Below)
|