| Vitasek Says: |
 If the average company is currently at a 25% error rate, as Gartner surveys suggest, the target of defect free data will require substantial effort and commitment. If the average company is currently at a 25% error rate, as Gartner surveys suggest, the target of defect free data will require substantial effort and commitment. 
|
In my first column on measuring data quality, we discussed how a Gartner survey found that more than 25% of critical data within business is inaccurate or incomplete. (See How Good is Your Supply Chain Data Quality? Part 1.) It is also true that few companies have a formal process in place to measure data quality or have in place a continuous improvement program.
Data quality metrics can remove the emotion, guesswork, and politics from the equation, providing a factual basis on which to justify, focus, and monitor efforts. As an added benefit, a commitment to a measurement program provides a real indication to the organization that the data quality is important to the company.
The goal is to track adequate metrics to clearly understand the true condition of data quality relative to the business requirements, while ensuring that the measuring and reporting of metrics can be done in a timely and cost-effective manner. The volumes and types of data, as well as the availability of suitable tools, will dictate how a company executes data quality metrics.
A simple methodology can be found in a common manufacturing metric. Many companies determine the reliability of their products using a simple, yet effective concept known as “defect parts per million.” This is a standard measure in Six Sigma quality programs. Defect parts per million (DPPM) can be defined as the average number of defects in an average production run multiplied by one million. DPPM is a statistic that is given as an estimation of the entire production quality.
DPPM = (# defects/# opportunities) x 1,000,000
DPPM is essentially a statistical tool that can be applied to assessing Data Quality. DPPM has, for example, been used to determine the reliability of information that the Internal Revenue Service provides to tax payers, so the concept is not foreign to data quality measurement. By taking a group of data records, for example, part master records, one can calculate the DPPM rate for the data.
Data DPPM = (# data defects/# data records) X 1,000,000
Example: 10,000 data records were checked, 12 had errors. The DPPM is 1200 ((12/10,000) X 1,000,000)). This simple calculation can be used to assess the error rate of data in the system. It is a good way to approximate the quality of data from a sample and to track changes over time.

In six Sigma,
a DDPM rate of 3.4 is the target rate (or 3.4 defects per million opportunities); this is considered virtually defect free. Defect-free data should be the ultimate goal. If the average company is currently at a 25% error rate, as the Gartner surveys suggest, the target of defect-free data will require substantial effort and commitment.
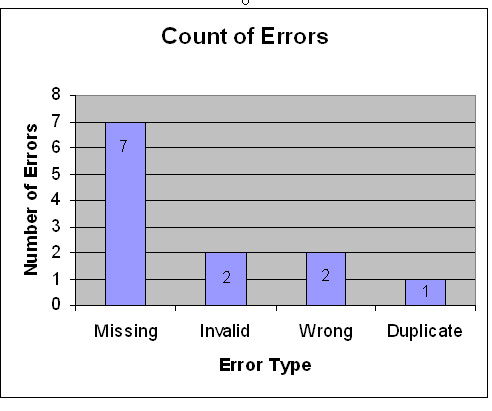
But the real power of metrics is in driving improvement. So, a critical part of Six Sigma programs is in understanding where the errors or variation comes from and taking action to eliminate it. In order to do this tracking, the type of errors found in the data is important. Typically, errors are grouped by type and are displayed in a Pareto Chart.
Let’s use a simple example. In the example above we had 12 data errors. The causes of the errors were found to be:
- 7 had missing data in a required field
- 2 had invalid entries in a field (outside the field tolerance)
- 2 had the wrong entry in a field
- 1 had a duplicate record
By tracking the type of errors, you can develop a focused plan to address the errors. In our simple example, missing data is the major cause of errors in the part master data records. To address this, the company may change programming to require an entry into specific fields to ensure that data is not missing.
Applying performance tools from other areas of business to data quality helps to take the perceived complexity out of measuring data quality. In our final installment on data quality, we will look at Data Cycle Counts as a way of tracking data accuracy.
Agree or disgree with our expert's perspective? What would you add? Let us know your thoughts for publication in the SCDigest newsletter Feedback section, and on the web site. Upon request, comments will be posted with the respondents name or company withheld.
|