SCDigest editor Dan Gilmore stirred the pot a bit last week with his First Thoughts column on "The Coming US Logistics Cost Crack-Up?", which went through some numbers to suggest US shippers could see 20%+ additional increases in rates over the next few years if a few developments fall into place.
Some of his calculations were based on numbers relative to the cost to operate a truck that come each year from the American Transportation Research Institute (ATRI), a group supported by dozens if not hundreds of US carriers and other institutions. You should take a look at the site- ARTI does really good work on a wide variety of topics.
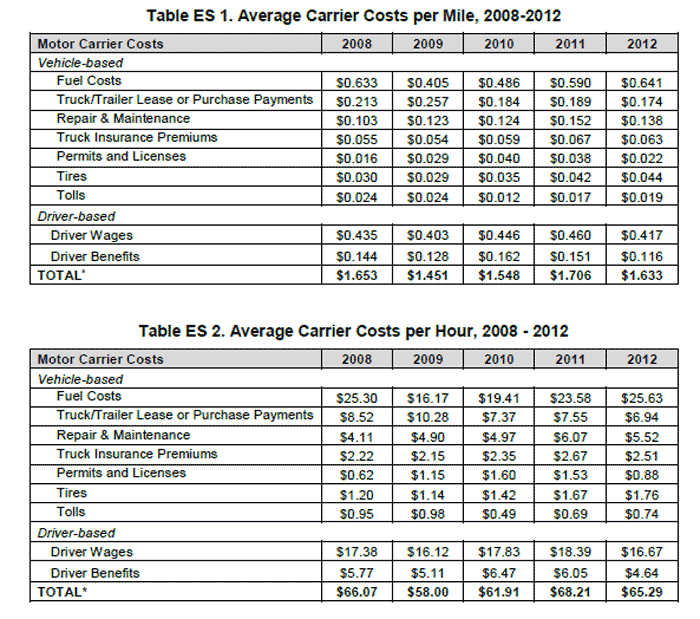
As noted above, for a number of years ATRI has taken input from carriers and built models on the cost components of truck operations. Below is the latest version, from 2013 based on 2012 data. The 2014 report based on 2013 data is still a few weeks away from being published.
Our graphic below shows both the components that add up to a total cost per mile of $1.63 in 2012, as well as the average costs by component per hour of operation.
US Trucking Cost Components 2008-2012

So, for example, you'll see that driver wages represented about 41% of operating costs in 2012 (.41/.99), after stripping out fuel costs out of the total, which can be thought about somewhat differently due to today's fuel surcharge programs.
That compares to about 38% in 2009 (.40/1.05).
In his piece, Gilmore said the current acute driver shortage might lead to wage increases for drivers as much as 34% over the next few years. How would that increase a carrier's cost and rates?
A 34% increase in 41% of a carrier's cost basis would lead to a 14% rise in those costs (.34 * .41), and it is assumed that would then be reflected in rate hikes of about the same magnitude.
Note the data implies truckers averaged about 40 miles per hour in 2012 (65.29/1.63).
We will also note these costs components include operational costs only - overhead costs are not included in the analysis.
Any Feedback on our Supply Chain Graphic of the Week? Let us know your thoughts at the Feedback section below.
|