This week, our Supply Chain Television Channel hosted its second largest Videocast ever in terms of audience size, focused on auto giant Ford's new approach to supplier risk management.
This outstanding event featured Dr. David Simchi-Levi of MIT and Michael Sanders of Ford, who discussed Ford's adoption of Simchi-Levi's Risk Exposure Index (REI) approach to quantifying and mitigating supply chain risk.
An on-demand version of this outstanding broadcast can be found here: New Approach to Supplier Risk Management at Ford.
In great summary, the REI approach involves calculating the "time to recovery" (TTR) from a major disruption at a supplier site. Once TTR is calculated, a resulting "financial impact" or hit to the bottom line from a disruption at a site can also be quantified. Summing up the FIs across the supply chain, or a portion of it, creates the total profit at risk from disruptions within that chain, or what Simchi-Levi calls the REI.
Simchi-Levi has used this approach at a high tech company, a pharmaceutical company, and others, but faced a new challenge at Ford, where the sheer number of tier 1, 2 and 3 suppliers is massive, in the multiple thousands of sites. That's beyond what even a company the size of Ford could handle in terms of calculating TTR and financial impact.
So Simchi-Levi and others at MIT developed an analytic tool to identify "bottleneck suppliers," defined by how quickly Ford would suffer a production disruption if a site went down and how many vehicles would be affected, considering normal pipeline inventory.
That whittled down some four thousand tier 1 sites to just a hundred or so where the impact would be greatest, and that is where Ford is focusing its TTR and FI analysis and resulting mitigation strategies, which often involve working collaboratively with a supplier to reduce a site's TTR.
"This approach has been one of the key gamechangers for us," Ford's Sanders said in the Videocast, because it produced a focused and manageable list of supply sites to work with.
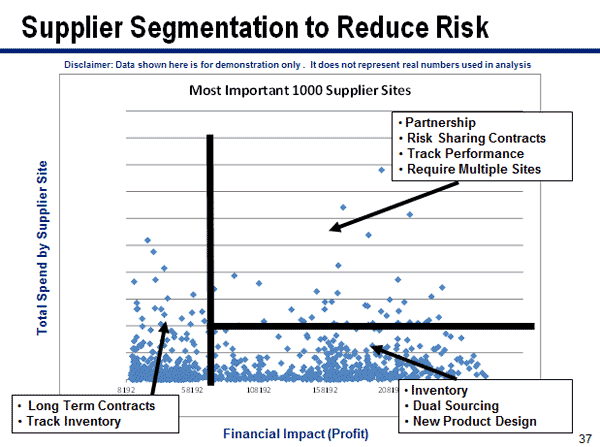
More generally, by analyzing suppliers along two dimensions, spend by site and financial impact of a disruption, Ford was able to put each site in one of three segments, as shown in the graphic below.

Source: David Simchi-Levi/MIT
As can also be seen, each segment comes along its own set of general approaches to reducing risk. And as Simchi-Levi noted in the broadcast, much of the overall risk and most of the bottleneck suppliers come from the segment ar the bottom right. Those are suppliers where annual spend is low, so that they usually do not get a lot of attention, yet the risk in terms of financial impact from a disruption at these suppliers is very high, often as much or more than at strategic suppliers.
All good stuff, we promise. Slides for the Videocast can also be found here: New Approach to Supplier Risk Management at Ford Videocast Slides
Any Feedback on our Supply Chain Graphic of the Week? Let us know your thoughts at the Feedback section below. |